Guidelines for Exam One Discussion Board
For this discussion post I was assigned to find a graph that shows a data set — it can be any type of graph.
I would then need to:
I would then need to:
- Identify the type of graph being used
- Identify variables in the graph — then decided if it's quantitative or qualitative.
- If it's quantitative: what is the center, dispersion, and shape
- If it's qualitative: common/least common category, the relative frequency, if there were 5,000 individuals
- If there's any misleading information
Exam One: Discussion Board — Original Post
|
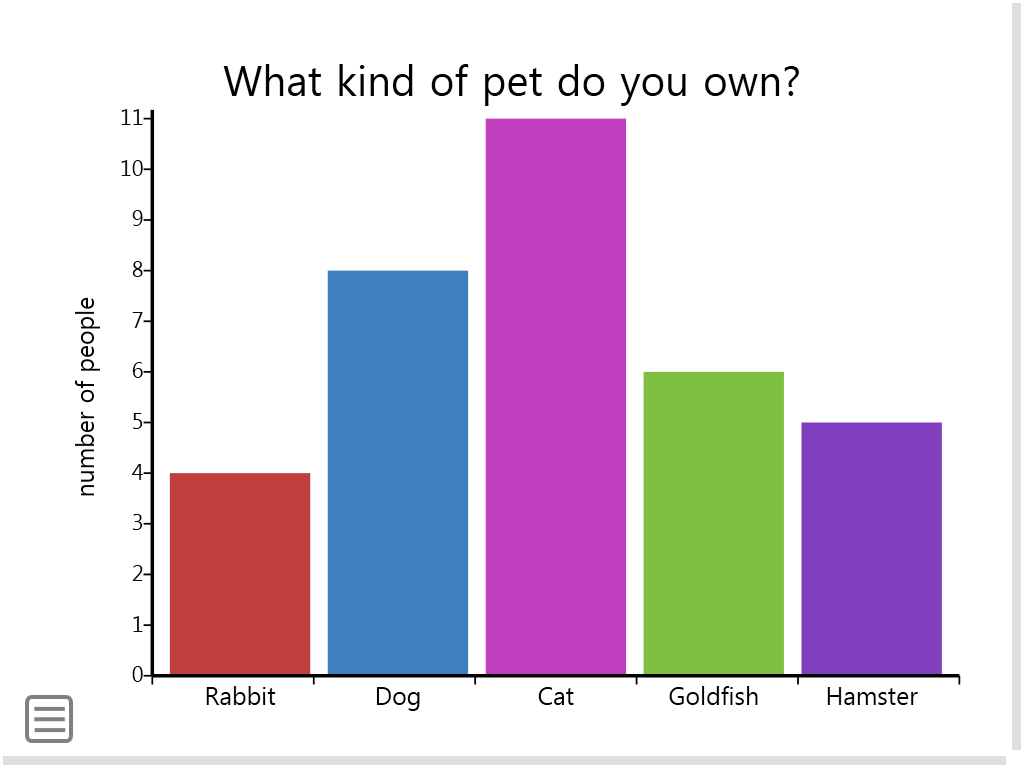
The graph that I have chosen for this discussion is a bar graph on what kind of pets do some individuals own. The data on this bar graph is qualitative because bar graphs are used to represent qualitative data. The variable of this graph is the type of animal — rabbit, dog, cat, goldfish, and hamster.
|
Reflection
- What have you learned as a result of this assignment?
- From this assignment I have learned that graphs can be easily manipulated and skewed — it's important when creating graphs not to create bias for consumers. Throughout this unit it was very interesting to see how many companies, corporations, organizations misuse graphs for exaggeration or for their own personal gain. I've also learned that just because it's math — "facts" does not mean it's actually true things can easily be skewed. I've noticed this more and more in the news and in social media.
- Discuss how the math skills that you applied in this assignment will impact other classes you will take in your school career or your future career.
- This math skill is applicable to me and the public relations and multimedia field because when do a case study on marketing statistical math is used. When it comes to finding out what type of social media out consumer use a poll is a great and accurate way to see the true feelings of customers, however we'd have to be to see how their could be sampling bias. Statistical math has a lot to do when it comes to figuring out where consumers stand and their views on a product or a company.
- Identify specific parts of the assignment and your own process in completing it that may have applications for other classes.
- This assignment has helped me to better at receiving criticism — I was so confident when I first submitted my discussion post, however, I did not read through my notes carefully and assumed the answer (I thought the graph was a quantitative when it was actually qualitative).
